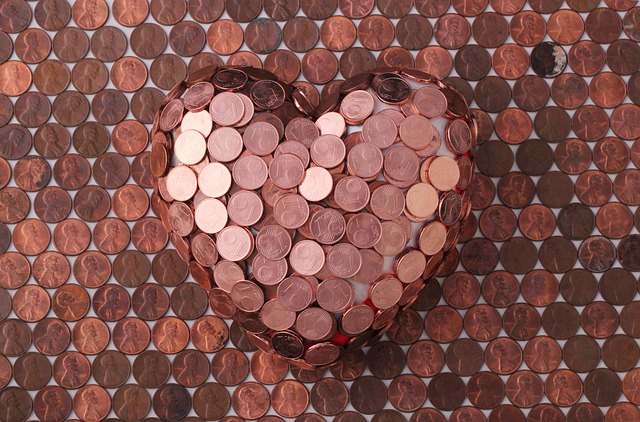
Image Recognition of Copper in Scrap via Machine Learning
Copper Scrap Digitalization
Our client
is a metal processing and recycling company in Bulgaria.
The need
The metal processing company has years of experience in the processing and recycling domain and the employees working for the processing plan have gained great expertise. However, the management of the company was looking for a way to automate the work of employees, who are handling the recognition and estimation of different metal compositions in the scrap (raw materials) the factory receives from different suppliers, starting with copper. Essentially to facilitate the copper content evaluation process by digitalizing it with machine learning.
The process of identification of the copper in scrap is as follows:
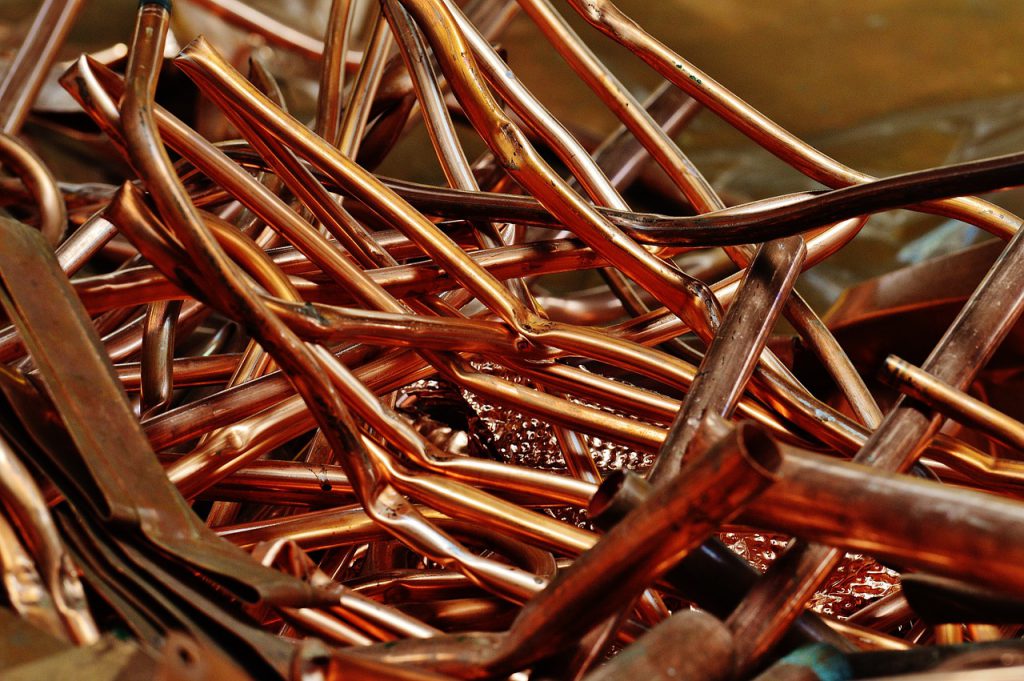
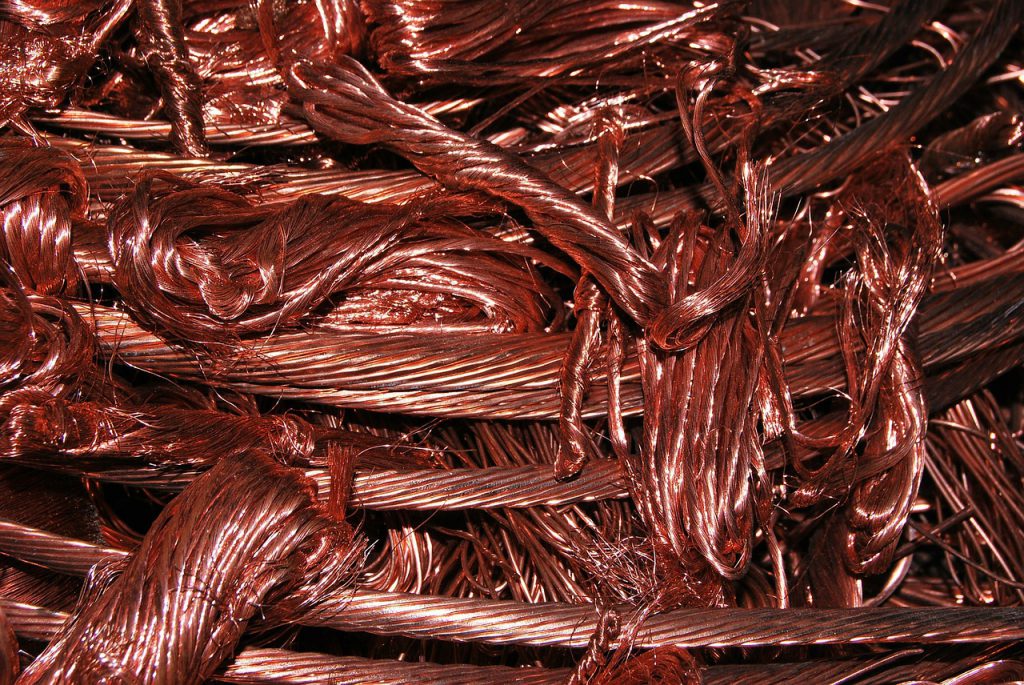
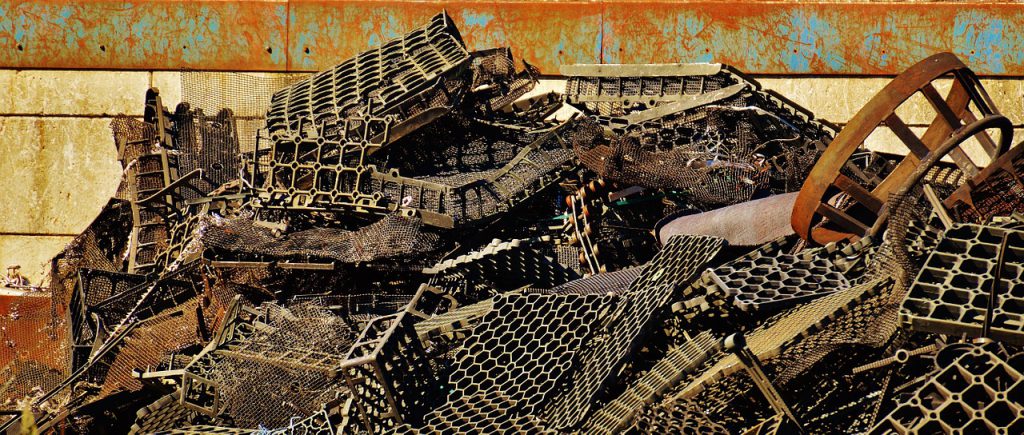
- The scrap (different metals and possibly other types of materials mixed together) is received on large chunks by external vendors in the processing facility.
- The trucks that deliver the scrap pile them in the processing facility and employees estimate the amount of metals in the piles by looking at them and checking with some specific instruments.
- After the approximate percentage of different metals are calculated and invoiced, based on this human prediction, is issued to the supplier of scrap.
- Only after processing the scrap our customer finds-out how accurate the prediction was.
This is essentially a standard process in the metal processing and recycling industry and with time the factory workers, responsible for estimating the copper (and other valuable metals) composition learn how to give good precision. However mistakes can be made. This is why our customer decided to trust us with applying specific Machine Learning algorithms to identify the percentage of copper in the different piles of scrap from different suppliers.
We agreed to have a good number of pictures of real piles of scraps and train our computer vision machine learning model against them.
The scope
- Performance of detailed tests of photo material, provided by our metal processing customer, for the qualification of the copper percentage content in the copper scrap delivered to the metal processing facility.
- Establishment of a quick and simplified model in order to set up the main starting point.
- Compilation and comparisons in order to extract the changes that lead to improvement.
Our approach
It was an exciting process as for the first iteration we were kind-of blindfold. Our customer gave us a good number of pictures that we had to train our model with. Initially, we ran them through our algorithm to see what happens. We did not know the actual composition of materials in those pictures and were not aware of how much is the % of copper in them. Only after we analyzed the first set and gave it to the customer to compare with the actual and validated copper composition percentage we realized that the model works. We were pretty close, but we had to do several repetitions of the process to reach the desired result.
Atanas Golev, CTO of ICB
Our approach was to:
- Create a model for the classification of the images in different classes for every group of pictures received by the customer (99,98,97,…<85). We had two groups of pictures (about 1800) – first group with evaluation of the copper content in the copper scrap (1500 pictures), and second group without such evaluation (300 pictures). The pictures met the following requirements: minimum of 20 pictures that cover the full spread out material; the pictures were in acceptable lighting and size (5MP and no more than 3MB per picture).
- Training the model with a bit more than 300 pictures from every range (21 ranges from 89.5% to 99.5% copper composition) without sampling the pictures by hand and without processing them. For instance we did not cut the pictures so that side objects will stay hidden, we have not removed low quality pictures, we have not changed the brightness, illumination and the balance of the colors.
- To train the model we use the following procedure: During a period of ten days we receive a set of pictures for each parcel for the day in different folders. The more pictures we receive the better. We are processing and sending the results back by folders. After that we receive the evaluations of the customer’s sampling managers for the parcels from the previous day and the new pictures for the new parcels. We re-train the model on the basis of the evaluations made by the customer sampling managers and process the new pictures. Then we return the results to the customer. The duration of the process took 10 days. During that time we are tracking the improvement of the results.
- We used three options to training the model:
- Microsoft Azure Custom Vision.
- Pre-trained Keras Resnet & MobileNetV2 Neural Networks. Gave the best results.
- TensorFlow Keras-Yolo3
The steps we took:
- Processing of the photo material before using it for training. This aims the higher quality of the first level model.
- Automatization of the group photos verification from one delivery, because the manual check is heavily time-consuming.
- Establish a recognition model for the objects of each photo (wires, tubes, etc…) that is similar to the current way of work performed by the sampling experts from the customer.
- Optimization of the second level function based on the results received from the work of the computer vision.
- Performing tests of all available groups by using additional photos, which are not linked with copper content, so that the experts from the customer will be able to compare their results with our results.
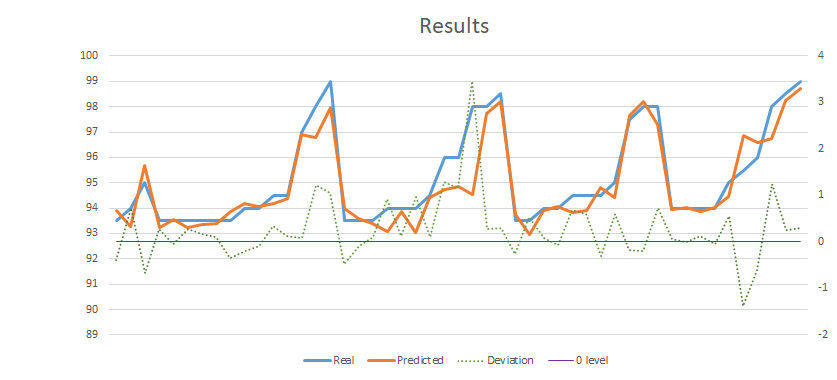
The result
- The model was tested by hand for the set of all pictures. We have analyzed the possibility of appurtenance of each picture to every of the other classes.
- We achieved an average deviation of 0.6 to 0.8 percent, which is extremely good
| 0.799411905 | 0.67264181 | 0.703814286 | 0.4453076 | 0.47563388 | 0.42538355 |
| 0.94672456 | 0.84098524 | 0.88789816 | 0.71474696 | 0.55305228 | 0.53870752 |
| 0.889055837 | 0.79982182 | 0.819965898 | 0.71665514 | 0.62833641 | 0.4929959 |
| 0.863138975 | 0.79435486 | 0.809402709 | 0.71553273 | 0.68139853 | 0.60132038 |
| 0.941478484 | 0.87917426 | 0.888722161 | 0.83481871 | 0.77483465 | 0.81484806 |
| 0.887961952 | 0.7973956 | 0.821960643 | 0.74543839 | 0.69485653 | 0.70808422 |
| Total | 0.68541223 | 0.62265115 | 0.57465108 |